(Publisher’s Note: This article is based on a presentation made by the author as part of the 50 Million Strong by 2029 Forum held at the 2017 SHAPE America National Convention.)
In 2016, SHAPE America made a commitment to ensure that by 2029 all of America’s youth will be “empowered to live healthy and active lives through effective health and physical education programs” (SHAPE America 2016). Since then, many people have asked how will we ensure that we are making progress toward this goal, or how and when will we know if we have achieved it? To this end, SHAPE America President Steve Jefferies appointed a Measurement Advisory Panel tasked with wrestling with these issues and identifying how we should begin to measure progress.
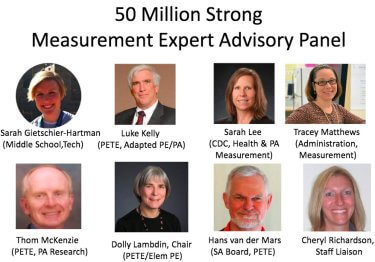
The Advisory Panel included the following professionals:
The Advisory Panel discussed measurement and tracking issues at some length and identified the following basic tenets:
- If we are to be successful, students must develop the skills, knowledge, habits, confidence and desire to be physically active and make healthy choices. They must be empowered to own their own health. If we teach them great skills and knowledge, but they do not choose to own them and use them, we will not have been successful.
- Whatever is used to measure progress toward the goal should relate to other SHAPE America positions and accepted guidelines. (e.g. National Standards, Appropriate Practices, Effective Physical Education, etc.). The national standards were chosen for their importance in developing a physically educated person. Because all of the standards are important, all must be included in assessing the effectiveness of our programming.
- Tracking progress needs to ensure that we are attending to and becoming more successful with ALL students. (i.e. girls, boys, LGBT students, students with disabilities, athletes, overweight, normal weight. outgoing, introverted, etc.).
- One of the long-term desired outcomes should be that any assessment helps parents and teachers better understand where a child is in relation to normal development.
- Policy creation has an immediate and widespread effect. For example, increasing the state requirement for graduation by an additional semester of physical education or health, impacts all the students in the state, whereas a great teacher is only able to influence the students in his/her care. Therefore, if we want to be successful in impacting all students, focusing on policy development is very powerful and should be a high priority.
- Whatever is measured will get attention and time. We must ensure that what is measured will lead to spending time on important elements that will generate support from the public.
Based on these tenets, many future projects should be developed if the profession is to make good on its commitment to achieving 50 Million Strong. Initially, the committee considered proposing the development of national-level valid and reliable data, but concluded this would be a too expensive and time-consuming project. Instead, we decided it was important to start by identifying national data that already existed and were considered valid and reliable, and respected by scientists and the public at large.

One of the main issues that people struggle with is how 50 Million Strong by 2029 is different from what the profession has done in the past. Physical and health education teachers across the nation are already working hard to ensure that students become physically active and are prepared to make healthy life choices. So, in many ways, this goal is not new.
But what IS significantly different in this new commitment is the intent to track progress toward that goal and being committed to problem solving and acting on those areas where we are not making reasonable progress. If we do this, we can become more strategic about what is needed to achieve the goal. Are more and more of our students choosing to be active outside our classes and actually meeting the national guidelines for physical activity? Are students making healthy physical activity, nutrition, hydration, safety, sexual and sleep choices in greater and greater numbers? Are we as a profession making progress in the development of national, state, and local educational and social policies that support our work?
Many people have questioned the value of having a year associated with the achievement of 50 Million Strong. To understand, imagine if back in the 60’sPresident John Kennedy had said “we are going to send a man to the moon and bring him home safely sometime in the future” instead of “we are going to send a man to the moon and bring him home safely in the next decade.” Absent a clear timeline, it’s doubtful that sufficient energy and resources would have come together to actually have Neil Armstrong and Buzz Aldrin walk on the moon and come home safely within ten years.
Viewing the recent movie “Hidden Figures”makes clear just how difficult that task was. The math and engineering didn’t exist yet to do what needed to be done, but people dug in and figured it out. 50 Million Strong by 2029 is essentially a commitment to gather data and use that data as a profession and as individual teachers to evaluate whether what we are doing is actually preparing students to be physically active and make healthy choices. If we learn that what we are doing is not preparing students to be physically active and make healthy choices, 50 Million Strong by 2029 is a commitment to change what we are doing to find more and more effective physical and health education programming.
The 50 Million Strong Measurement Advisory Panel identified three important outcomes related to having all students graduate physically active and making healthy choices. These three outcomes include: (1) Students meeting the national physical activity guidelines for being active 60 minutes/day; (2) Students making healthy choices (in nutrition, physical activity, hydration, sleep, sexual activity, tobacco and drugs); and (3) Policies that enable teachers to be successful in their work.
After identifying key outcomes, the next step was to identify measures that were accepted by scientists, the general public, and health professionals as valid and reliable for measuring these three outcomes. If the public didn’t value and believe in the measures SHAPE America was tracking, there would be no support for our efforts. In the committee’s view, it is imperative that the public accepts and embraces the measures chosen as meaningful, valid and reliable if we hope to develop public support for our efforts.
For this reason, three existing data sets already generated by the Centers for Disease Control and Prevention (CDC) and SHAPE America were identified to track outcomes: The CDC’s Youth Risk Behavior Surveillance System (YRBSS) and School Health Policies and Practices Study (SHHPS); and SHAPE America’s SHAPE of the Nation Report.
Youth Risk Behavior Surveillance System (YRBSS)
YRBSS, which was developed in 1991, monitors health-risk behaviors that are often developed during adolescence through a survey given to high-school youth. Behaviors monitored include unintentional injuries and violence, sexual behavior related to unintended pregnancy and sexually transmitted diseases, alcohol and other drug use, tobacco, unhealthy dietary behaviors, inadequate physical activity, asthma and obesity.
YRBSS seeks to determine the prevalence of health behaviors among 9ththrough 12thgraders and assess whether they are increasing or decreasing as well as any co-occurrences. YRBSS provides comparable data at the national, state, territorial, tribal and local levels. A national random sample of high school students complete the survey every other year. There is also a middle-school survey that can be conducted by interested large urban school districts, tribal governments, states and territories. Because there is data reaching back to 1991 it is possible to see the direction of trends over time. Individual school districts can also access their own data and examine the impact of intervention activities in the district.
School Health Policies and Practices Study (SHHPS)
SHHPS assesses health policies at classroom, school, district and state levels. It was designed to help monitor changes in key policies over time. SHPPS collected state and district data in 2012 and school and local data in 2014. SHPPS includes data on Faculty and Staff Health Promotion, Health Education, Health Services, School Environments, Mental Health and Social Services, Nutrition Services and Physical Education and Activity. The CDC provides Fact Sheets on SHPPS data as well as combinations of SHPPS and YRBS data.
Shape of the Nation Report
The Shape of the Nation Report is a combined project of the American Heart Association and SHAPE America conducted approximately every four years. Shape of the Nation solicits information from state education agencies on policies and practices within their state.
___
From these national studies data points were chosen to focus on. It’s proposed that these data points be reviewed each time the studies are conducted (usually every 2-years) with targets set every 3-years. In each case, we will move from current levels of practice through a series of target increases to the moonshot goal of influencing all students. Dashboards will be created so professionals and the general public can track progress. Strategies will be developed both nationally and by individual teachers for enabling us to meet each target. Those strategies will be implemented and the data used to determine the impact of the strategies.
Data from these studies gathered by nationally recognized government health agencies will allow us to track success at moving toward having all students graduate physically active and making healthy choices. Table 1 provides baseline information of the percentage of students currently physically active 60 minutes per day. Tables 2 and 3 provides baseline data on health behaviors.
Table 1
Physical Activity Outcome
| Outcome | Data Source | Trend from 2011 | Benchmark 2015 Data | 2017 Data (to be added) |
| All kids physically active–meeting national PA guidelines | ||||
| Were physically active at least 60 minutes per day on all 7 days (doing any kind of PA that increased HR and made them breathe hard some of the time during the 7 days before survey) | YRBSS 2015 | No change | 27.10% | |
| Were physically active at least 60 minutes per day on 5 or more days (doing any kind of PA that increased HR and made them breathe hard some of the time during th 7 days before survey) | YRBSS 2015 f | No change | 48.60% | |
| Did not participate in PA on at least 1 day doing any kind of PA that increased HR and made them breathe hard some of the time during the 7 days before survey) | YRBSS 2015 | No change | 14.30% |
Table 2
Health Behaviors Outcome
| Outcome | Data Source | Trend from 2011 | Benchmark 2015 Data | 2017 Data (to be added) |
| Meeting guidelines for dietary behaviors, including fruits, vegetables, added sugar, fats. | ||||
| Ate fruit or drank 100% fruit juices three or more times per day (during 7 days before survey) | YRBSS 2015 | Decreased from 24.9% in 1999 | 20% | |
| Ate vegetables three or more times per day (green salad, potatoes (excluding french fries, fried potatoes or potato chips) carrots or other vegetables during 7 days before survey | YRBSS 2015 | No change since 1999 | 14.80% | |
| Consumed at least ONE sugar-sweetened beverage on any given day | NCHS Data Brief No. 271 January 2017 | 62.90% | ||
| Consumed at least TWO sugar-sweetened beverage on any given day | NCHS Data Brief No. 271 January 2017 | 20.2% (boys) 18.1% (girls) |
||
| Consumed at least THREE sugar-sweetened beverage on any given day | NCHS Data Brief No. 271 January 2017 | 11.5% (boys) 9/5% (girls) |
||
| Meeting guidelines for sleep | ||||
| Had 8 hours or more of sleep on an average school night | YRBSS 2015 | 27.30% | ||
| Reduced long bouts of sedentary time | ||||
| Playing video or computer games or using a computer for something non-school/homework related 3+ hours per day | YRBSS 2015 | 41.70%
|
||
| Watched TV 3+ hours per day | YRBSS 2015 | 24.70% |
Table 3
Smoking & Alcohol Outcomes
| Outcome | Data Source | Trend from 2011 | Benchmark 2015 Data | 2017 Data (to be added) |
| Decreased use of tobacco/alcohol/drugs | ||||
| Currently drank alcohol (at least one drink of alcohol on at least one day | YRBSS 2015 | Decreased from 50.8% in 1991 | 32.8% | |
| Drank five or more drinks of alcohol in a row (within a couple of hours on at least 1 day during the 30 ays before the survey | YRBSS 2015 | Decreased since 1999 (31.5%) | 17.70% | |
| Currently smoked cigarettes (for at least 1 day during the 30 days before the survey) | YRBSS 2015 | Decreased from 34.8% in 1999 | 10.80% | |
| Currently smoke cigarettes frequently (on 20 or more days during the 30 days before the survey) | YRBSS 2015 | Decreased from 16.8% in 1999 | 3.40% |
SHAPE America is in the process of developing a dashboard of this data for tracking national 50 Million Strong progress and, where possible, encouraging states to do the same. Local school districts are encouraged to collect similar local data. Gathering the data is of course only the first step. We must think deeply about what elements of our programs we would expect to result in students choosing to be active 60 minutes a day and engage in healthy behaviors, and identify new strategies in teaching that we would expect to impact these goals.
For any areas where the data shows we are not making the progress needed to be successful, action plans need to be developed. If students are not active 60 minutes a day we need to determine what the barriers are and address them. Do they not have the skills, the confidence, the desire, or the opportunity? Have they not been empowered by the experiences we have provided? On the national scale, are not enough teachers providing effective programs? How can we connect with more teachers? In district settings where the data is about our own programs (e.g. district YRBSS), we as teachers need to reflect deeply on our programming and identify and enact local action plans to become more effective. What an exciting time lies ahead!
What has been described thus far is a national high-school level data review effort to track our 50 Million Strong progress and guide our actions. Of course, if we want students to have the skills, knowledge, competence and desire to be physically active and make healthy choices we must continue to develop effective physical and health education programs. There is a need for teacher-level assessments that showcase student mastery of key knowledge, skills, and behaviors. Judy Rink is heading up a committee to work on identifying those key teacher-level assessments for elementary, middle and high school that can be used to determine progress in ensuring that their students are mastering the national standards.
Returning to the basic tenets identified by the measurement advisory panel at the beginning of this article provides direction for additional measurement targets as we move forward. As we work to empower students to own their own health we need to be developing and sharing projects that result in portfolios demonstrating that students have the skills, knowledge, confidence, habits and desire to be physically active and make healthy choices. We need to ensure that we are teaching to all the national standards and including all students in our efforts.
As assessments are developed we must ensure that they are areas the public believes are important and that they help students, parents and teachers better understand where they are on the developmental continuum and strategies for further development. Finally, we need to clearly assess what policies are possible at the national level and a plan for working toward those. Perhaps more importantly, we need to study where we are in policy development in each state and help states create strategic plans for improving the policies at state, school district, and school level to support helping all students graduate from high school physically active and making healthy choices.
As indicated by the paragraph above there is a lot to be done, but it starts with all of us committing to working to achieve 50 Million Strong by 2029. We can each start by looking at our own state YRBSS data and the SHAPE of the Nation Report and thinking deeply about what we need to do to improve the results of these surveys.
(See next issue of PHE America for 2018 Update “Tracking Progress”)
— Contribute an Article on HPE —
Contact: pheamerica20@gmail.com

Looks like a heavy lift Dolly, but I’m down to try:) Best of luck to us all…the luck we make with our hard work of course!